

Table of Contents
Introduction to AI Data Analysis
Defining AI Data Analysis
AI analytics harnesses the power of machine learning algorithms to automate the extensive and complex task of monitoring and analyzing vast data sets. Traditionally performed by data analysts, this automation significantly streamlines the process, making data analysis more efficient and far-reaching.
The Intersection of Business Analytics and AI
In the ever-evolving landscape of technology, AI’s impact is ubiquitous and profound, influencing a myriad of industries, including business analytics. This field, once grounded in traditional statistical modeling techniques, is now undergoing a transformation, propelled by AI and machine learning. These technologies introduce unprecedented speed, scale, and granularity, offering insights and capabilities beyond human reach.
Deciphering Analytics in the Business World
Analytics is the art of extracting meaningful patterns from data. In the business context, it’s about applying these patterns to answer critical questions, make predictions, discover new relationships, and drive better decision-making. It involves transforming raw data into actionable insights using various analytical techniques such as applied mathematics, statistical analysis, AI, and machine learning.
The Gartner Analytic Ascendancy model, developed by Gartner, describes four different stages of analytics maturity: descriptive analytics, diagnostic analytics, predictive analytics, and prescriptive analytics. Organizations in the later stages of the model are considered more “mature” in their use of data and analytics, as they are consistently using data to make decisions and continuously optimizing their data processes.
The model is a useful way of thinking about data maturity and can help organizations understand what they can achieve with data. It identifies the progression of statistical tools from descriptive statistics to diagnostic methods, predictive methods, and finally prescriptive analytics. This model is widely used and recognized in the field of data and analytics.
- Descriptive Analytics: Understanding what has happened in the past.
- Diagnostic Analytics: Exploring why certain events or changes occurred.
- Predictive Analytics: Anticipating future events or trends.
- Prescriptive Analytics: Determining actions to achieve desired outcomes.
Core Tenets of AI Data Analysis
Machine Learning and AI: Foundations of Modern Data Analysis
Artificial Intelligence (AI) is a broad field of computer science focused on enabling machines to emulate human cognitive functions like learning, problem-solving, reasoning, and representation. AI finds applications in diverse areas, including language processing, self-driving cars, gaming, and analytics, utilizing approaches like statistical techniques, search optimization, and neural networks.
Machine Learning, a subset of AI, involves using algorithms and statistical models to perform tasks without explicit programming, relying instead on patterns and inference. It involves creating models trained on data to make predictions or decisions.
AI analytics is a subset of business intelligence that uses machine learning techniques to automate the data analysis traditionally done by analysts. It enhances their capabilities, allowing for more rapid analysis of larger and more detailed data sets.
Gartner’s concept of augmented analytics represents the next phase in analytics, integrating AI and machine learning to autonomously reveal patterns and insights in data, reducing the need for data scientists.
Decoding Algorithms in AI Data Analysis
AI algorithms are a set of instructions or rules that enable machines to learn, analyze data, and make decisions based on that knowledge. These algorithms work by taking in training data that helps the algorithm to learn and can be used for various applications such as data entry and classification, predictive analytics, search engines, digital assistants, robotics, medical image analysis, finance, retail, and e-commerce.
AI analytics, which incorporates various elements of analytics and artificial intelligence, can be used for fraud detection, personalized recommendations, inventory management, customer service automation, and more.
In data analysis, AI uses machine learning algorithms to process large volumes of data to identify patterns and create AI models, and common AI techniques used in data analysis include machine learning.
Machine learning is a sub-field of artificial intelligence that uses different approaches to learn depending on the dataset and the problem, and specific algorithms are used for different categories of machine learning problems.
Contrasting AI Analytics with Traditional Analytics
Traditional data analytics, typically conducted by a team of analysts, is a more time-consuming and hypothesis-driven process. Analysts form hypotheses about data changes or trends, test these against the data, and then present their findings and recommendations.
AI analytics, in contrast, uses machine learning algorithms to constantly monitor and analyze large data sets. It excels in scale, speed, and accuracy, identifying anomalies, conducting root-cause analysis, and offering unbiased, objective analysis far quicker than traditional methods.

AI Data Analysis in Action: Real-World Applications
Business Applications of AI Analytics
AI analytics is employed across various industries, including:
- Predictive analytics in supply chain management for demand forecasting.
- AI techniques for predictive maintenance of equipment.
- Diagnostic analytics in monitoring customer experiences, revenue, and costs.
AI Data Analysis in E-commerce and Beyond
- eCommerce Analytics: AI analytics helps understand conversion rate changes by analyzing multiple data points.
- Fintech Analytics: AI is used for detecting and preventing security issues by monitoring operational metrics.
- Telco Analytics: AI answers stability and customer service questions by identifying changes in service quality.
- Cloud Cost Analytics: AI helps manage and optimize cloud costs, correlating expenses with business KPIs.
Summary
AI significantly enhances the capabilities of traditional business analytics. It reduces manual labor in hypothesis formation, data processing, and visualization, making analytics more responsive to the fast-paced business environment. This shift towards AI analytics empowers businesses to react swiftly to changes, enhancing decision-making and strategic planning.
Tools and Technologies in AI Data Analysis
In an era where data is akin to digital gold, AI data analysis tools have emerged as the quintessential miners, unearthing valuable insights from mountains of data. From Polymersearch.com to Tableau.com, and beyond, these tools are revolutionizing how we comprehend and utilize data. Let’s delve into some of the top tools reshaping the landscape of data analysis.
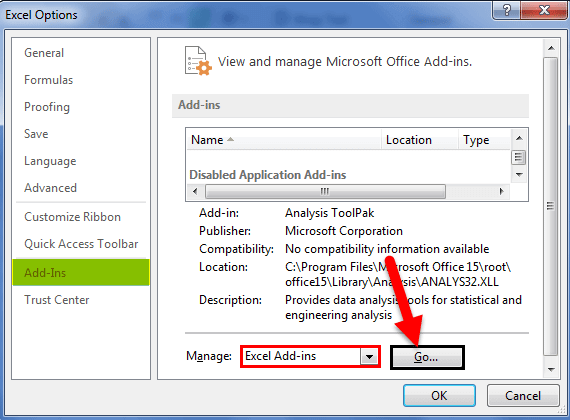
Microsoft Excel Toolpak
Microsoft Excel’s Data Analysis Toolpak is a powerful add-in that enhances Excel’s capabilities, allowing users to perform complex statistical and financial analysis efficiently. Here’s a detailed look at its features:
- Comprehensive Statistical Tools: The Toolpak offers a broad range of statistical analysis options, including descriptive statistics, correlation, regression, t-tests, ANOVA, and more.
- Data Visualization Capabilities: Users can create histograms, box plots, scatter plots, and other visual representations to better understand and present their data.
- Descriptive Statistics: This tool generates a report of univariate statistics, providing information about the central tendency and variability of data.
- Exponential Smoothing: Used for forecasting, it predicts values based on prior period forecasts and adjusts for the error in those forecasts.
- F-Test Two-Sample for Variances: Performs a two-sample F-test to compare two population variances, useful in various statistical analyses.
- Fourier Analysis: Solves problems in linear systems and analyzes periodic data using the Fast Fourier Transform (FFT) method.
- Histogram Tool: Calculates individual and cumulative frequencies for a range of data and data bins, useful for determining the distribution of scores or values.
- Moving Average Analysis: Projects values in the forecast period based on the average value of the variable over a specified number of preceding periods.
- Random Number Generation: Generates independent random numbers drawn from several distributions, useful in simulating and characterizing various scenarios.
- Rank and Percentile Analysis: Produces a table with the ordinal and percentage rank of each value in a data set, aiding in understanding the relative standing of values.
- Covariance Tool: Computes covariance for pairs of measurement variables, useful in determining the extent to which two variables vary together.
- Correlation Analysis: Evaluates the relationship between two or more variables, using correlation coefficients ranging from -1 to +1.
- Anova Analysis Tool: Used for analyzing statistical differences between the means of independent groups, particularly useful in research and experimental data analysis.
- Ease of Use: Accessible under the ‘Data’ tab in Excel, the Toolpak is user-friendly and helps in automating many complex data analysis tasks, thus saving time and effort.
- Advanced Statistical Functions and Data Mining: It offers advanced statistical functions like regression analysis, analysis of variance, and data mining tools such as correlation analysis and random sampling.
- The Data Analysis Toolpak in Microsoft Excel simplifies complex statistical calculations and data visualization, making it a vital tool for data analysts, researchers, and anyone involved in data-driven decision-making. Its integration with Excel provides a seamless experience for performing advanced data analysis within a familiar environment.
- From creating basic visualizations to deploying machine learning models, Excel’s Toolpak makes data processing accessible to a wider audience. Although limited by its spreadsheet nature, Excel’s adaptability to modern data demands is noteworthy. Explore the toolpak’s features here.
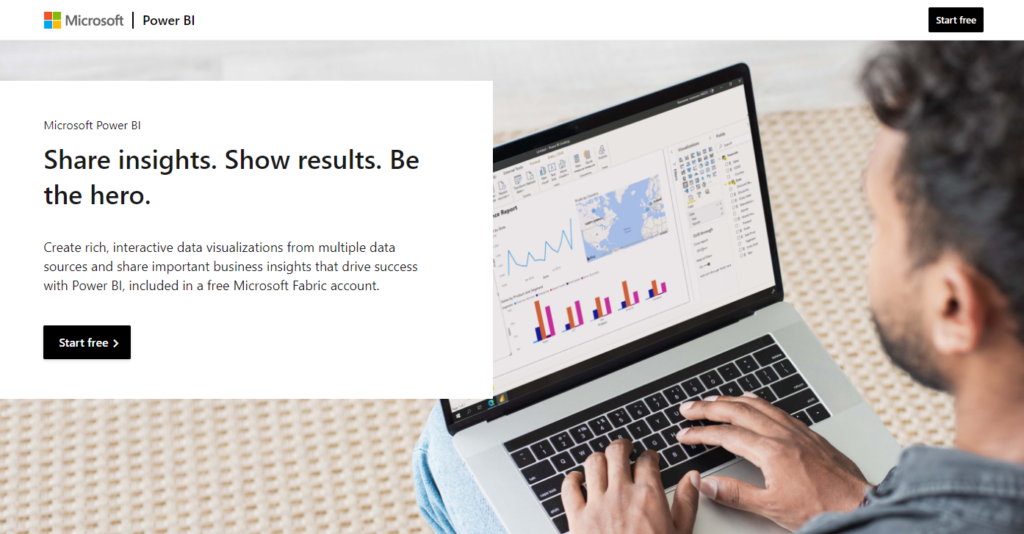
PowerBI by Microsoft
What is Power BI?
Power BI is a collection of software services, apps, and connectors that work together to turn unrelated sources of data into coherent, visually immersive, and interactive insights. Offered by Microsoft, it’s a powerful business analytics tool that enables users to visualize their data and share insights across an organization or embed them in an app or website.
Key Features of Power BI
- Data Visualization: Power BI provides advanced data visualization capabilities, allowing users to create highly interactive and compelling reports and dashboards.
- Data Integration: It can connect to a wide variety of data sources, ranging from basic Excel sheets to databases, and cloud-based and on-premises hybrid systems.
- Customization and Flexibility: Users can customize dashboards and reports to meet specific organizational needs. It also offers flexibility in terms of deployment – cloud-based or on-premises.
- Advanced Analytics Capabilities: With built-in AI capabilities, Power BI can provide advanced analytics, including forecasting, trend identification, and insights discovery.
- Real-time Data Processing: Power BI can handle real-time data processing, which is crucial for time-sensitive decision making.
Components of Power BI
- Power BI Desktop: A free desktop application where users can create reports and data visualizations.
- Power BI Service: An online SaaS (Software as a Service) service where users can publish their reports and data visualizations.
- Power BI Mobile Apps: Available for iOS, Android, and Windows devices, these apps allow users to access and interact with their Power BI reports and dashboards on the go.
- Power BI Gateway: Used to sync external data in and out of Power BI. It can be used to keep the data fresh and up-to-date.
- Power BI Report Server: An on-premises report server where Power BI reports can be published.
Power BI in Business Context
Power BI allows businesses to aggregate data from multiple sources, transform and visualize it, and share insights throughout the organization or with specific individuals or groups. It supports a data-driven culture by empowering even non-technical users to create and explore data in an intuitive interface.
Use Cases of Power BI
- Sales Analysis: Sales teams use Power BI to track performance metrics and analyze sales trends.
- Financial Reporting: Finance departments use it for budgeting, forecasting, and financial reporting.
- Customer Insights: Marketing teams utilize Power BI to gain insights into customer behavior and campaign performance.
- Supply Chain Management: It assists in monitoring supply chain operations and identifying potential areas for optimization.
Integration with Other Microsoft Products
Power BI integrates seamlessly with other Microsoft products like Azure, SQL Server, and Excel, making it a robust tool for businesses that already use Microsoft’s ecosystem.
Learning and Community Support
Microsoft provides extensive learning materials and a community forum for Power BI users. There are also numerous third-party resources, online courses, and community-driven support channels.
Conclusion
Power BI, accessible via powerbi.microsoft.com, is a versatile tool that offers a wide array of capabilities for data integration, analytics, and visualization. It’s particularly valuable for organizations looking to harness their data for more informed decision-making and strategic planning. Its user-friendly interface, combined with powerful back-end capabilities, makes it a preferred choice for businesses of all sizes.
While it might come at a premium, the platform’s responsiveness and integrations, including with Microsoft Excel, make it a worthy investment for comprehensive data handling. Discover more about Power BI here.
Google Cloud Looker
Google Cloud Looker is a significant tool in the realm of data analysis and business intelligence. Here’s an overview of its capabilities:
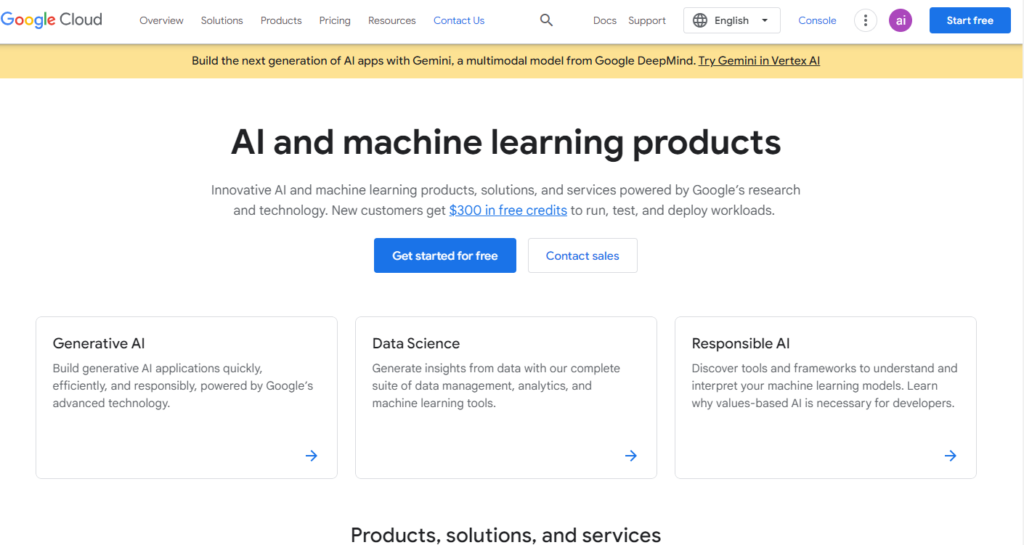
- Data Visualization and Analysis: Looker enables users to analyze and visualize data interactively, integrating insights across different data sources to build actionable data-driven workflows and create custom data applications.
- Real-time Data Access and Analysis: The combination of Looker’s data modeling capabilities with Google Cloud’s infrastructure allows businesses to perform real-time analysis on data, enabling informed decisions on-the-fly.
- Enterprise-Grade Features with Looker Studio Pro: This version includes collaboration capabilities and integration with Dataplex, providing data lineage and metadata visibility. It’s designed for larger organizations requiring enterprise-focused features.
- Semantic Data Modeling Capability: Looker’s semantic modeling promotes the reuse of data and analyses, enhancing data consistency and reliability across an organization.
- Integration with Tableau: This integration allows Looker to be used as a centralized source of data while utilizing Tableau for front-end data analysis and visualization, offering flexibility and more trusted data access for users.
- Looker in Google Cloud Console: The new version of Looker, integrated with Google Cloud’s infrastructure services like security and system administration, is available in the Google Cloud Console, offering deeper integration with Google Cloud services.
- Integration with Google Sheets: Looker’s upcoming integration with Google Sheets is expected to enhance its usability, making data analysis and visualization more accessible and interactive.
- Collaboration and Self-service BI Workflows: Looker Studio Pro aims to streamline data sharing and facilitate more self-service BI workflows, making it easier for non-technical users to access and analyze data.
- Future Visualization Tools: Google plans to develop new visualization tools for Looker Studio to compete with market leaders like Microsoft and Salesforce, expanding its capabilities in data presentation and analysis.
- Google’s Vision for Business Intelligence: Google’s vision for BI involves creating a trusted platform for reliable data-driven decision-making, promoting informed decisions through self-service workflows, and developing data experiences that change how data is accessed and worked with at scale.
- Integration within Google Cloud Ecosystem: Looker is being integrated across Google’s unified Data Cloud, allowing it to connect with various Google Cloud solutions and front up Google’s data and analytics strategy.
- Low-Code/No-Code Automation Workflows: Looker’s integration with Google Cloud promotes greater accessibility to insights through low-code or no-code automation workflows, potentially disrupting market leaders in the BI space.
In summary, Google Cloud Looker has evolved into a central component of Google’s data and analytics offerings, providing robust tools for real-time data analysis, visualization, and business intelligence. Its integration with Google Cloud infrastructure and other data analytics platforms positions it as a versatile and powerful tool for businesses seeking comprehensive data solutions.
SAP
SAP offers robust solutions for AI data analysis through its BusinessObjects Business Intelligence suite and SAP Analytics Cloud. These platforms provide advanced features and capabilities to enable efficient, insightful, and predictive data analysis for businesses.

- Reporting and Analysis: SAP BusinessObjects BI suite empowers users with ad-hoc queries and BI reporting, enabling them to understand trends and root causes within their business data.
- Data Visualization and Analytics Applications: This suite allows users to build impactful visualizations, dashboards, and applications, enhancing their ability to assess risks, improve efficiency, and identify new opportunities.
- Office Integration: It offers multidimensional data analysis capabilities for comprehensive filtering, manipulation, and trend identification within data sets.
- SAP Analytics Cloud: This solution provides a centralized console for monitoring and reporting, equipped with AI and sensors for anomaly detection and decision support. It offers modernized reporting, dashboarding, and visualization tools, along with on-demand data exploration and analysis capabilities.
- Real-time Decision Making: SAP Analytics Cloud facilitates direct access to critical business process data for real-time insights, supporting live queries and embedded analytics for cloud offerings like SAP S/4HANA Cloud, SAP SuccessFactors, and more.
- Integrated Planning Engine: The platform combines analytics, BI, and planning capabilities, enabling users to simulate, forecast, and collaborate effectively. It leverages machine learning for high-accuracy forecasting and planning-led collaboration.
- Industry-Specific Best Practices: SAP Analytics Cloud is designed for enterprise-wide adoption with AI-infused analytics tailored for specific functions and industries. It offers prebuilt and customizable business content packages to facilitate high-impact analytics.
- Diverse Data Source Connectivity: SAP Analytics Cloud can connect to a wide range of on-premise and cloud data sources, maintaining integration with mission-critical SAP applications and other data sources.
- SAP Business Technology Platform: SAP’s Data & Analytics solutions are part of this platform, offering a foundation for intelligent enterprise. It encompasses a range of tools for data management, analytics, application development, and integration, along with intelligent technologies like robotic process automation and conversational AI.
- End-to-End Data and Analytics Scenarios: SAP provides various demo scenarios showcasing how its Data & Analytics solutions can be leveraged and combined for real business value, addressing different industry needs and integrating with SAP and non-SAP systems.
These capabilities illustrate SAP’s commitment to providing comprehensive and advanced solutions for AI data analysis, catering to diverse business needs and enhancing decision-making processes with predictive insights and real-time analytics.
Julius AI
Julius AI is an innovative data analysis tool that excels in simplifying the complex realm of interpreting and visualizing structured data. Here are some of its AI data analysis capabilities:
- Data Analysis: Julius AI is adept at performing robust data analysis, making it suitable for analyzing a wide range of structured data like financial records and survey results.
- Versatile Data Source Connectivity: It can seamlessly connect with various data sources, including Excel spreadsheets, Google Sheets, and Postgres databases, allowing users to analyze data from diverse origins.
- Data Visualization: Julius AI offers extensive data visualization options, including bar charts, histograms, and heat maps, transforming raw data into meaningful visual representations.
- User-Friendly Interface: The tool features an intuitive interface that simplifies the data analysis process, making it accessible to users without extensive data science or statistics background.
- Question-Driven Analysis: A standout feature is its question-driven analysis. Users can interact with their data by asking questions, and Julius AI analyzes and provides insightful answers.
- Chat with Your Data: Julius AI allows users to upload data and engage in natural language conversations with AI to extract valuable insights and trends.
- Create Graphs and Visual Representations: It can convert data into visually compelling graphs, charts, and diagrams.
- Build Forecasting Models: Julius enables users to anticipate future trends and outcomes based on historical data patterns by training forecasting models.
- Perform Advanced Analysis: The tool supports advanced analysis like linear regression and modeling to uncover actionable insights from large data sets.
- Turn Data into GIFs: Julius AI can animate data visualizations, turning them into engaging GIFs for enhanced storytelling and comprehension.
- AI Answer Engine: This feature provides quick answers to general knowledge questions and in-depth analysis of industry-specific queries, citing authoritative sources from the Internet.
Julius AI’s capabilities make it a valuable asset for various users, including marketing teams, healthcare professionals, academics, economists, and sales and commerce sectors. Its ability to simplify complex data tasks, combined with its user-friendly approach, positions Julius AI as a game-changer in the realm of data analysis. Try it here.
AnswerRocket
AnswerRocket is an advanced AI-powered analytics platform that revolutionizes how businesses interact with and analyze their data. Here’s an overview of its key features and capabilities:

- AI-Powered Analytics: AnswerRocket employs generative AI, integrating large language models like OpenAI’s GPT-4 to offer conversational analytics. This allows users to ask natural language questions and receive instant insights on their data, making sophisticated data analysis more accessible and intuitive.
- Max, the AI Assistant: Max is AnswerRocket’s AI assistant for data analysis, providing a chat-based interface for data exploration. Users can interact with Max to get narrative answers, insights, and visualizations based on their proprietary data, making data analysis more user-friendly and immediate.
- Advanced Analysis Capabilities: Max can perform advanced analysis, including statistical, diagnostic, and predictive analytics. This feature allows businesses to access deeper insights, empowering decision-makers across various teams.
- Data Visualization: Along with narrative insights, AnswerRocket offers data visualization capabilities, ensuring that users can not only understand their data through conversation but also see it represented graphically for better comprehension.
- Natural Language Technology: Utilizing NLP (Natural Language Processing) and NLG (Natural Language Generation), AnswerRocket allows users to have a conversation with their data, asking questions in natural language and receiving answers they can understand.
- Customizable Analyses with Skill Studio: AnswerRocket’s Skill Studio lets users create specialized Skills and Copilots to address unique data analysis needs, enabling customization to reflect the specific analytics, visualization, and language preferences of a business.
- Self-Service Analytics Model: The platform removes barriers between the machine and user, allowing business users to directly interact with analytics, ask scenario analysis questions, and get answers without needing deep technical expertise.
- Structured and Unstructured Data Support: Max supports analysis of both tabular and text-based data, allowing companies to glean insights from a variety of enterprise data sources, documents, and multiple data sources in a single conversation.
- Automated Routine Analysis Workflows: Max can execute multi-step analytics processes automatically, freeing up analyst time for strategic projects and providing business stakeholders with timely analysis and self-service answers to ad hoc questions.
- Enterprise-Grade Security and Scalability: Compatible with all major cloud platforms, AnswerRocket leverages APIs to provide security, scalability, and compliance, making it suitable for enterprise applications.
- Integration with Third-Party Tools: Max can be embedded into tools like Power BI, Slack, Teams, and CRMs, enabling users to analyze their data in the tools they are already using.
In summary, AnswerRocket is a versatile and powerful analytics platform that leverages AI to transform data into actionable insights. Its focus on conversational AI, advanced analytics, and user-friendly interfaces makes it an ideal solution for businesses seeking to enhance their data-driven decision-making capabilities.
Polymer
Polymersearch.com stands out for its versatility across various organizational functions. Marketing teams leverage it to identify successful channels and customer trends, while sales teams enjoy accelerated access to performance data. What truly sets Polymer apart is its user-friendly nature, allowing operations teams to construct dashboards and conduct analyses on-the-fly, sans technical complexities. This ease of use democratizes data handling within an organization, making Polymer a go-to solution for real-time data analysis.

Tableau.com
At the heart of data visualization is Tableau, a platform where complexity meets simplicity. Users interact with data effortlessly, sans coding, making Tableau a beacon for intuitive data analysis. Whether it’s creating real-time dashboards or generating comprehensive reports, Tableau stands tall with its robust feature set. It supports vast databases and offers a plethora of visualization options, making data not just accessible but also comprehensible. Opt for cloud-based or on-premise solutions with Tableau, and elevate your data analysis to new heights. Learn more about how Tableau harnesses AI for business analytics here.

Monkeylearn.com
MonkeyLearn revolutionizes text data analysis by embedding AI at its core. It’s a haven for those looking to extract nuanced insights from text data without delving into coding. With its AI-powered text analysis tools, users can effortlessly categorize data and extract vital information. Whether it’s understanding customer sentiments or classifying support tickets, MonkeyLearn’s classifiers and extractors offer unparalleled efficiency. Its intuitive UI simplifies complex data tasks, making it a preferred choice for businesses seeking actionable insights from text data. Explore MonkeyLearn’s capabilities here.
PyramidAnalytics
Pyramid Analytics takes a user-centric approach to data analysis. It blends simplicity with power, offering drag-and-drop tools within a responsive UI, thus streamlining the analytics process. What sets it apart is the “In-Chip” technology, allowing users to switch between RAM and CPU for faster data processing, especially with large datasets. While its visualization capabilities might be limited, it’s an ideal platform for those with straightforward visualization and reporting needs, particularly when handling smaller datasets. Dive into Pyramid Analytics here.

Sisense
Sisense stands out in the realm of data analytics for its dual appeal to analysts and developers alike. Its ease of use, characterized by drag-and-drop functionalities, makes data visualization a breeze. Sisense’s unique selling point is its ability to balance simplicity with powerful analytics, catering to users who prefer a straightforward approach to data handling. This platform is a testament to how user-friendly interfaces can coexist with robust data analysis capabilities. Explore Sisense and its offerings here.
Domo
Domo stands as a beacon in the business intelligence landscape, offering a suite of features that cater to the modern data analysis needs. Its strength lies in its ability to integrate multiple data sources, presenting a unified view that aids strategic decision-making. Domo’s user-friendly interface and real-time data processing capabilities make it a top choice for businesses seeking an all-encompassing BI tool. For more details, visit Domo’s website.

Akkio
Akkio specializes in business analytics and forecasting, providing users with tools to analyze data and predict outcomes. Its no-code platform includes lead scoring, enabling efficient qualification and segmentation of leads. Akkio’s predictive capabilities, combined with a fast and intuitive interface, make it a go-to solution for businesses focused on forecasting and data-driven decision-making. Discover Akkio’s innovative approach to data analytics here.

Qlik
QlikView offers a sophisticated business intelligence and data visualization solution, tapping into AI technology for in-depth data analysis. Its platform is versatile, accommodating both technical and non-technical users. The seamless collaboration, intuitive drag-and-drop editors, and workflows make QlikView a potent tool for data manipulation and exploration. While it comes with a higher price tag, QlikView’s functional range justifies the investment for businesses seeking comprehensive BI solutions. Learn more about QlikView here.

Integrating AI Tools into Data Analysis Strategies
Integrating AI tools into data analysis strategies offers various benefits, including speed, efficiency, and automation. AI tools can process data faster than humans, leading to quicker and more accurate insights. They can also assist in explaining analysis, fact-checking, and validation, thereby expediting the data analysis process and enabling real-time insights. To effectively integrate data analytics and artificial intelligence into process design, it is essential to choose the right AI tools that match the objectives, ensure data quality, and prioritize the robustness, availability, and security of data sources. By harnessing the power of AI tools, businesses can optimize their process design for efficiency, quality, and customer satisfaction.
AI in data analysis is not just a trend; it’s a paradigm shift in how we interpret and leverage data. The tools discussed offer a gateway to this new world, where data becomes a source of invaluable insights. Whether you’re a seasoned analyst or a budding enthusiast, these AI-powered tools are your companions in the journey of data exploration.
FAQs
What is AI Data Analysis?
- AI Data Analysis refers to the use of Artificial Intelligence, particularly machine learning algorithms, to analyze and interpret complex datasets, automate data processing, and derive meaningful insights.
How Does AI Data Analysis Differ from Traditional Data Analysis?
- Unlike traditional data analysis, which often requires manual intervention, AI Data Analysis automates the process, handling larger volumes of data more efficiently and uncovering patterns that might be missed by human analysts.
What are the Key Benefits of AI Data Analysis?
- The primary benefits include enhanced accuracy in predictions, speed in data processing, scalability in handling big data, and the ability to uncover deep insights through advanced pattern recognition.
Which Industries Benefit Most from AI Data Analysis?
- Industries like healthcare, finance, marketing, retail, and telecommunications are significantly benefiting from AI Data Analysis, using it for predictive analytics, customer behavior analysis, fraud detection, and more.
What Skills are Essential for an AI Data Analyst?
- Key skills include proficiency in programming languages (like Python or R), understanding of machine learning algorithms, data visualization, statistical analysis, and domain-specific knowledge.
Can AI Data Analysis Improve Business Decision-Making?
- Absolutely. AI Data Analysis provides deeper insights into market trends, customer preferences, and operational efficiencies, thus enabling more informed and strategic business decisions.
What are the Challenges Faced in AI Data Analysis?
- Challenges include ensuring data quality and integrity, managing large volumes of data, addressing data privacy concerns, and staying updated with rapidly evolving AI technologies.
Is AI Data Analysis Expensive to Implement for Small Businesses?
- The cost can vary, but with the advent of cloud-based AI tools and platforms, AI Data Analysis is becoming more accessible and affordable for small businesses.
How Does AI Data Analysis Handle Data Privacy and Security?
- AI Data Analysis must comply with data privacy regulations like GDPR. Techniques like data anonymization and secure data environments are used to protect sensitive information.
What is the Future of AI Data Analysis?
- The future looks towards more advanced forms of machine learning, like deep learning, integration with IoT for real-time analytics, and further democratization of AI tools, making them accessible to a wider range of users.
How can AI improve data analysis?
- AI tools can process data much faster than humans, leading to quicker and more accurate insights. They can also assist in explaining analysis, fact-checking, and validation, thereby expediting the data analysis process and enabling real-time insights.
What are some examples of AI data analysis?
- AI is used in data analysis for various applications such as sentiment analysis, personalized recommendations, fraud detection, inventory management, and customer service automation.
What are the best tools for AI data analysis?
- Some of the top AI tools for data analytics in 2024 include Tableau, Polymer, Power BI, Julius AI, and Akkio, each offering unique features and strengths.
How is AI impacting the role of data analysts?
- With the increasing prominence of artificial intelligence, the skills, roles, and decision-making processes of data analysts are evolving. Data analysts must possess knowledge of AI and machine learning concepts in addition to core analytical abilities.
What are the benefits of integrating AI into data analysis workflows?
- Integrating AI into data analysis workflows expedites the data analysis process, allowing for real-time insights and predictive capabilities. It also helps in automating tasks, improving efficiency, and providing more insightful analysis.


Pingback: AI Response Generator: How To Best Communicate-2024 - AI Profit Now
Pingback: Amazons GPT44X: The Most Powerful Yet-2024 - AI Profit Now
Pingback: Chat GPT Stock Price: How To Best Invest in 2024 - AI Profit Now